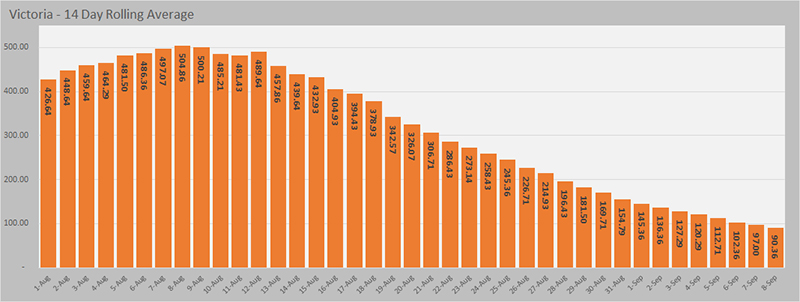
Given that the Victorian easing of restrictions is linked to the 14 day rolling average for new cases, here is a chart depicting the current movement in those numbers.
Note that the guidelines for the next Stage in the road map are based on 'metro' and ' regional' having different targets but I don't have a readily available data set to split between the two so these are the State based averages and thus show a worse result than metro would in isolation. The target is 30-50 new cases on a rolling 14D average.
The move to the 3rd stage (> 26 October and < 5 cases Statewide) is back to whole of State numbers as is the 4th stage (0 cases for >=14D).
I'll add that graph to each of the daily stats.